PACS provides 5 different observing modes (3 for the Photometer and 2 for the Spectrometer). Every observing mode is linked to an Astronomical Observation Template (AOT), which includes necessary information for planning an observation.
|
PACS supplies three photometer observing modes:
In the following the observing modes are described in detail.
|
PACS Photometer characterisctics
| Band Name |
Blue |
Green |
Red |
| Central Wavelength (µm) |
70 |
100 |
160 |
| Wavelength Range (µm) |
60-85 |
85-130 |
130-210 |
| Pixel Scale (arcsec) |
3.2 |
6.4 |
| FOV (arcmin2) |
3.5 x 1.75 |
| FWHM (arcsec) |
5.2 |
7.7 |
12 |
| Number of Pixels (lines x columns) |
32x64 |
16x32 |
| Number of sub-arrays (lines x columns) |
2x4 |
1x2 |
| Sub-array angolar dimension (arcsec) |
51.2 |
102.4 |
|
The Point-source photometry with PACS is assigned for observing sources that are significantly smaller than a single sub-array (a region of about 50 arcsec in diameter).
Two different observing modes are provided: the chopped-nodded mode and the mini scan-map mode.
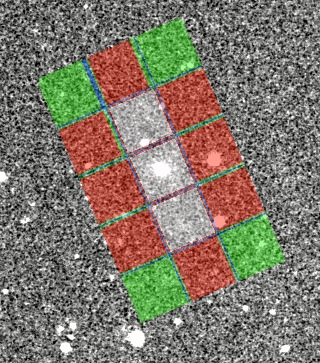
Footprint on the sky of Point-source AOT. For an chop/nod cycle,
the white area is covered 4 times, red 2 times and green 1 time.
The white rectangular area is the properly imaged fiels
(52 arcsec x 2.5 arcmin).
Chopped-nodded mode.
In this mode the observation is performed using the 4-position on-array chopping-nodding technique.
The 5σ sensitivities over 1 hour integration time are 6.6, 7.8, 14.8 mJy for the blue, green and red channels respectively.
The minimum observing time is 332 seconds of which 124 are effectively spent on the source, the remaining being overheads.
To improve the sensitivity the measurement can be repeated n times.
The effective integrating time on the source is n x 124, while the total observing time must take into account the telescope and instrument overheads.
The achieved sensitivity scales as the inverse of the square root of the repetition factor n.
This observing mode is not recommended for sources below ~50 mJy or above ~50 Jy.
To avoid that nearby strong sources fall within the useful chopping area, it is possible to specify particular angles to be avoided ( chopper avoidance angle).
For more detailed information about the Chopped-nodded observing mode, see this page.
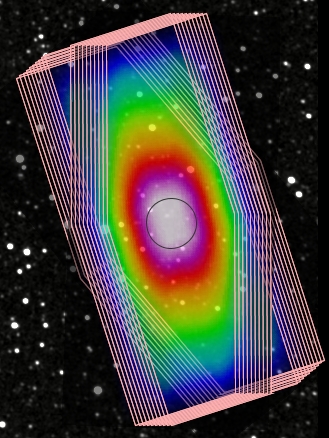
Coverage map for a nominal plus othogonal mini scan-map.
The homogeneous, high-coverage area (circle)
is about 50 arcsec in diameter.
Mini scan-map mode.
A mini map is provided by moving the array with a constant speed of 20 arcsec/s along a small and aven number (4,6,8,10) of parallel legs, with small leg separation (2-5 arcsec).
The length of the legs is generally selected at 3 arcmin.
Scanning is performed in array coordinates at 70/110 deg, in order to align the scan direction along the diagonal of the array.
To improve the sensitivity and, in particular, when extended sources are present on the map, it is suggested to acquire 2 consecutive orthogonal mini scan-maps.
In this case, the obtained map shows a central homogeneous, high-coverage area with a diameter of 50 arcsec.
The execution time of a mini map composed by the concatenation of 2 quasi-orthogonal direction is 567 second (for 6 scan legs with a separation of 4 arcsec and leg length of 3 arcmin) of which 104 seconds are effectively spent on the source.
To improve the sensitivity, the concatenated observation can be repeated a number of times ( n). The effective integrating time on the source then multiply the previous time by n, while the total observing time must take into account the telescope and instrument overheads. Broadly, the efficency grows increasing the n value (from ~0.2 with n = 1 to ~0.3 with n = 6.
The 5σ sensitivities over 1 hour integration time are 3.9, 4.8, 10.7 mJy for the blue, green and red channel respectively, referring to the 3 arcmin legs configuration.
For more detailed information about the Mini scan-map observing mode, see this page.
Back to top
|
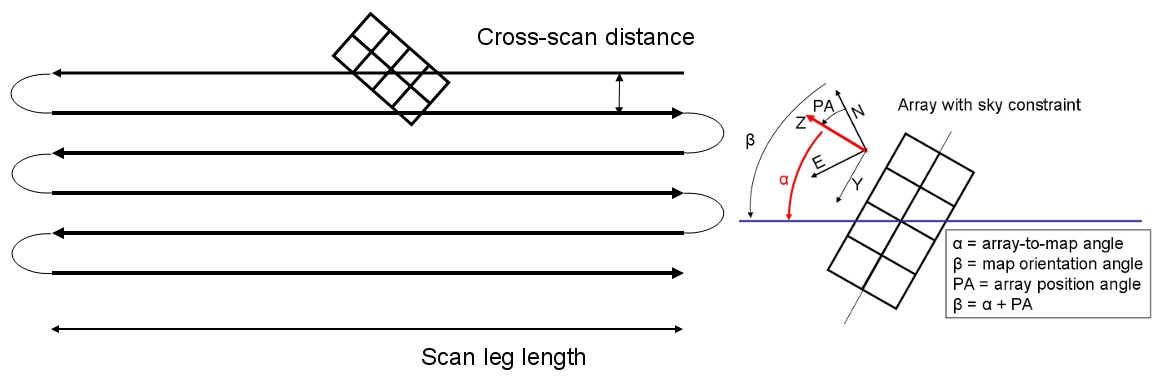
Schematic view of a PACS scan map with 6 scan lines. On the right, a scheme of the reference angles of the array in sky constraint.
This observing mode is intended to obtain large scale surveys.
In the scan mapping mode, the instrument acquires images while the telescope is moving at a constant speed and it is intended to map large areas of the sky (larger than 15x15 arcmin2) for galatic and extragalactic surveys.
Three scanning speeds can be chosen: 10 arcsec/s, 20 arcsec/s and 60 arcsec/s.
Given an equal sky area, observing at a greater speed requires a lower observing time.
In the assessment of which speed to prefer for the observations, it must considered that with the increase of the scanning speed:
- sensitivity is lowered on the point sources;
- a degradation of the PSF occurs.
In fact, in the scan mapping mode, an on-board averaging of 4 frames is performed, which reduces the sampling frequency to 10 Hz (instead of 40 Hz), due to the available band for the transmission of data to ground.
If the telescope scans with a speed of 10 arcsec/s, the 10 Hz sampling corresponds to a sky movement of 1 arcsec, well below the telescope diffraction figure.
At 60 arcsec/s in a tenth of a second the telescope is displaced 6 arcsec, a quantity comparable with the diffraction figure at 70 µm and 100 µm.
To cover the area to be mapped, the telescope scans along parallel lines.
The telescope has to accelerate to reach the required observing speed and, once the line scan is finished, it has to be decelerated, set for the following line and accelerated again.
The time lost to accelerate and decelerate can be longer than the total observing time if the area to be observed is small.
For example, for a 15x15 arcmin 2 area, the total observing times at a speed of 60"/s and at 10"/s are 509 and 839 seconds respectively, i.e. with a factor of 6 in speed only a factor of 1.6 is gained in time.
If the map is half a degree squared, the time gain factor increases to 2.3 (921 seconds vs 2109); for an area of one degree squared the time gain factor is 3.3.
The 5σ sensitivities over 1 hour integration time are 2.6, 3.0, 5.7 mJy for the blue, green and red channels respectively. The sensitivity at any point of a scan map can be derived by scaling the 5σ/1h sensitivity numbers with the inverse of the square root of the integration time provided by the Exposure Map in HSpot.
To remove efficiently the stripping effect due to the 1/f noise, it is suggested to use two maps of the same region with orthogonal scanning angles (the total observing time will then double).
For more detailed information see this page.
Back to top
|
Properties of PACS Photometer Observing Modes*
|
Chopped-nodded |
Mini scan-map |
Large map**
(scan speed 10'/s) |
Large map**
(scan speed 20'/s) |
Large map**
(scan speed 60'/s) |
| target size |
point source |
point source |
> 15 arcmin2 |
> 15 arcmin2 |
> 15 arcmin2 |
On-source time
(s) |
124 |
206 |
2160 |
1080 |
360 |
Overheads
Instrument+Satellite
(s) |
208 |
585 |
430 |
480 |
660 |
Tolal observation time
(s) |
332 |
791 |
2590 |
1560 |
1020 |
Efficency
(on-source/total) |
0.37 |
0.26 |
0.84 |
0.69 |
0.35 |
5 σ/1h; sensitivity
(70,100,160 µm)
(mJy) |
6.6, 7.8, 14.8 |
3.9, 4.8, 10.7 |
2.6, 3.0, 5.7 |
2.6, 3.0, 5.7 |
2.6, 3.0, 5.7 |
* The values in the table are obtained assuming a repetition factor of 1.
** The values for the Large mapping modes refer to a map of 30x30 arcmin2 with homogeneous coverage and a position angle of 45 deg.
|
|
The strength of the PACS Spectrometer is its high spectral resolution. Thus it is aimed at the study of emission/absorption lines other than continuum emission (although a SED mode is available too). The principal spectometer observing modes are:
These mode are described following, while the spectometer characteristics are presented in the table.
|
PACS Spectrometer characterisctics
| spectral range (µm) |
55 - 210 |
| λ/Δλ |
1000 - 5000 |
| FOV (arcsec2) |
47 x 47 |
| Number of spatial pixels (spaxels) |
5 x 5 |
| spaxel scale (arcsec) |
9.7 |
| Number of detector pixels |
16 x 25 |
|
This observing mode is intended to observe one or more spectral features (up to 10) on a fixed wavelength range of about 1 µm.
Only lines belonging to the first and second order (70 - 220 µm) and first and third order (55 - 73 µm and 102 - 210 µm) can be observed within a single AOR.
If the 70 - 220 µm interval is chosen, a gap between 98 and 103 µm is present due to the discontinuity between first and second order. Spectral lines can not be requested in this insensitive range.
The observer can choose two different techniques for the background subtraction: the Standard Chopping-nodding mode or the Unchopped Grating Scan mode.
The Unchopped Grating Scan was released on September 2010 (see the Release Note) and it replaces the Wavelength-switching mode, which will no longer be used.
For information about the Unchopped Grating Scan mode for line spectroscopy mode see this page
In the Standard Chopping-nodding mode, the grating scans in such a way that a given wavelength is seen successively by all 16 spectral pixels. Three chopper throws are available: Small (1 arcmin), Medium (3arcmin), and Large (6 arcmin). Moreover, a Bright lines option is available, where it is not necessary to spend as much time per line, as in the Standard Chopping-nodding mode (performing only 16 grating steps istead of ~45).
For more detailed information about the Standard Chopping-nodding mode, see this page.
Two pointing modes are offered in the Line range spectroscopy:
- Pointed mode: this is the default mode for point-source spectroscopy.
The 5 x 5 pixels array (corresponding to a field-of-view of 47" x 47") is centred on the selected coordinates.
The Pointed with dithering mode was decommissioned as consequence of tests performed during the Performance Verification Phase (see this section further details)
- Mapping: in this observing mode, a raster map of the sky is performed. The map dimension depends on the selected background subtraction mode:
for the chopping/nodding mode, the map size is restricted to 6 arcmins, while in the wavelength-switch mode the map size can increases up to 2 degrees.
|
In the Range scan spectroscopy mode, spectral features can be observed over a wavelength range wider than 1 µm.
This mode is intended to detect a set of close lines or to study broad lines larger than a few 100 km/s.
As in the Line spectroscopy mode, two pointing modes (Pointed mode and Mapping) and three chopper throws are available (small, medium and large).
Moreover, two observing modes can be selected in range spectroscopy:
- Range scan
:
as in the Line spectroscopy mode, only scans ranging in the first+second order or first+third order intervals can be selected.
In particular, the following three order combination are available in range scan:
- 70 - 105 µm plus 102 - 220 µm (second plus first orders). In the Blue band, the filter B is selected;
- 51 - 73 µm plus 102 - 220 µm; (third plus first orders). In the Blue band, the filter A is selected;
- 51 - 73 µm plus 102 - 146 µm; (second plus first orders). Only the A filter range in the Blue band is covered in the second diffraction order.
The sample density for the grating scan can be set similarly to the Line spectroscopy (high sample density) or at the Nyquist frequency.
The high sample density can be very time consuming for long wavelength ranges: for a full up/down scan in the 55-73 µm interval, more than 5 hours are required.
Therefore the Niquist sampling is the default for a large wavelength range coverage.
- SED mode
:
in this observing mode, the far infrared Spectral Energy Distribution (SED) of a target is performed by sampling the full PACS wavelength range at the Nyquist frequency.
Two wavelength range are available:
- SED B2B + long R1: 70 - 105 µm plus 140 - 220 µm;
- SED B2A + short R1: 51 - 73 µm plus 102 - 146 µm;
For more detailed information about the Range scan mode mode see this page.
Back to top
|
|